
Create DAX Measure Documentation In 5 Seconds That Stays Up-To-Date Forever
A short story how best practices are formed in real life

Have you ever created a report with a live connection to Power BI semantic model?
Then you know how annoying it is when you click on a measure to see how it’s calculated and… you don’t see the DAX code 🤬. Now, you might add the DAX expression to the measure description, but it doesn’t work well with long measures and there is no way to copy the code.
To overcome this limitation, I recommend creating a measure documentation table using the INFO.VIEW.MEASURES() DAX function.
Let me tell you my 3-phase journey how I ended up to that conclusion.
Phase #1: Minimum Viable Product
Last year I wrote about creating a Power BI setup that runs on autopilot.
As a part of that post, I recommended creating a simple txt file that contains all the DAX measures and share the file with all data model users for example via Teams group. It worked and it was easy for business users. Anyone could easily search, and reuse measures.
While this method got the job done, it also had multiple weak points:
The need to manually maintain the txt file (which is a nightmare 😒)
The file only contained DAX code and missed all measure descriptions
No way to filter the file to show only measures that contain a specific DAX function
Lesson learned: when you’re first starting out things don’t need to be perfect so don’t make it complicated. To develop a best practice, you need to first try something.
You need to have a minimum viable product before moving to…
Phase #2: The New Opportunity
After I while I started to think: there has to be a better way to get this done.
So, I googled around a bit and found out that you can create a measure documentation Excel file using DAX Studio in 3 quick steps.
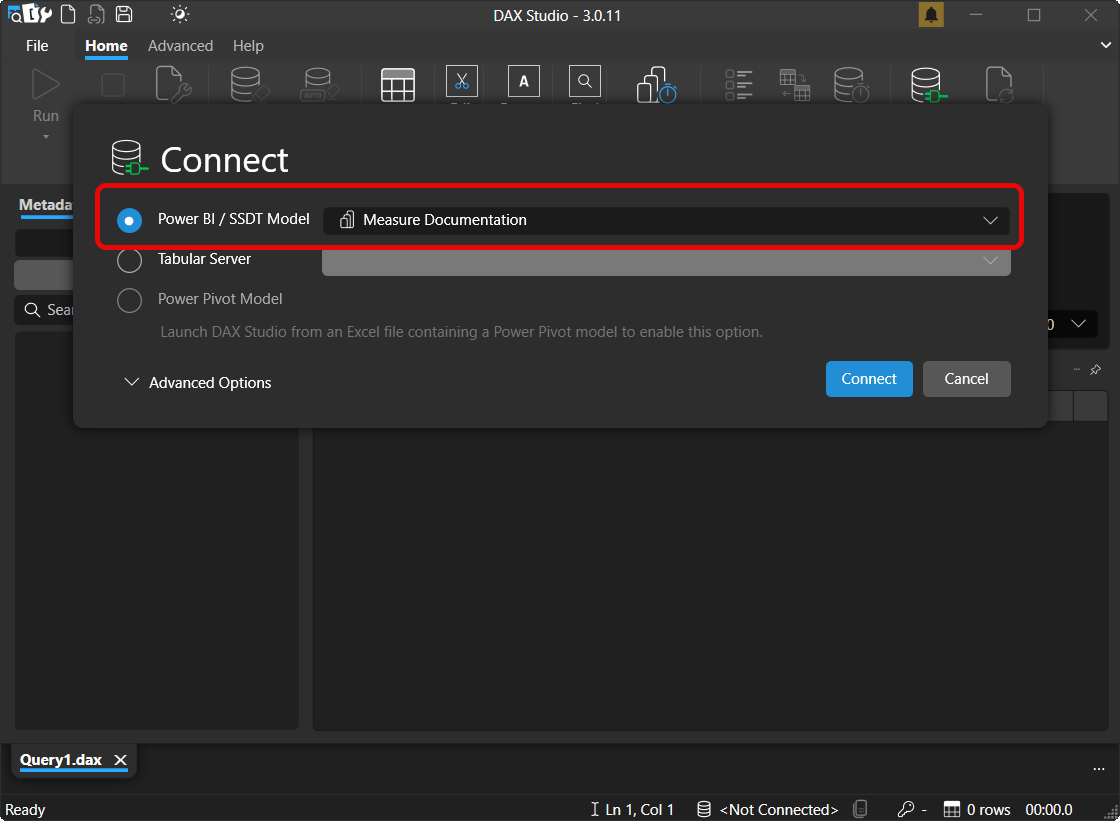
Step #1 — Connect Your Data Model To DAX Studio
First you need to install DAX Studio (if you don’t have it yet) and connect it to your model using the “Power BI / SSDT Model” option. To do this you need to have your pbix file open.
Step #2 — Decide Output Type & Run Query
Once you’re connected to the model paste the below code in the editor. This will get all the information about your measures. Don’t ask me how it does it, it just does 🤷♂️.
select * from $SYSTEM.MDSCHEMA_MEASURES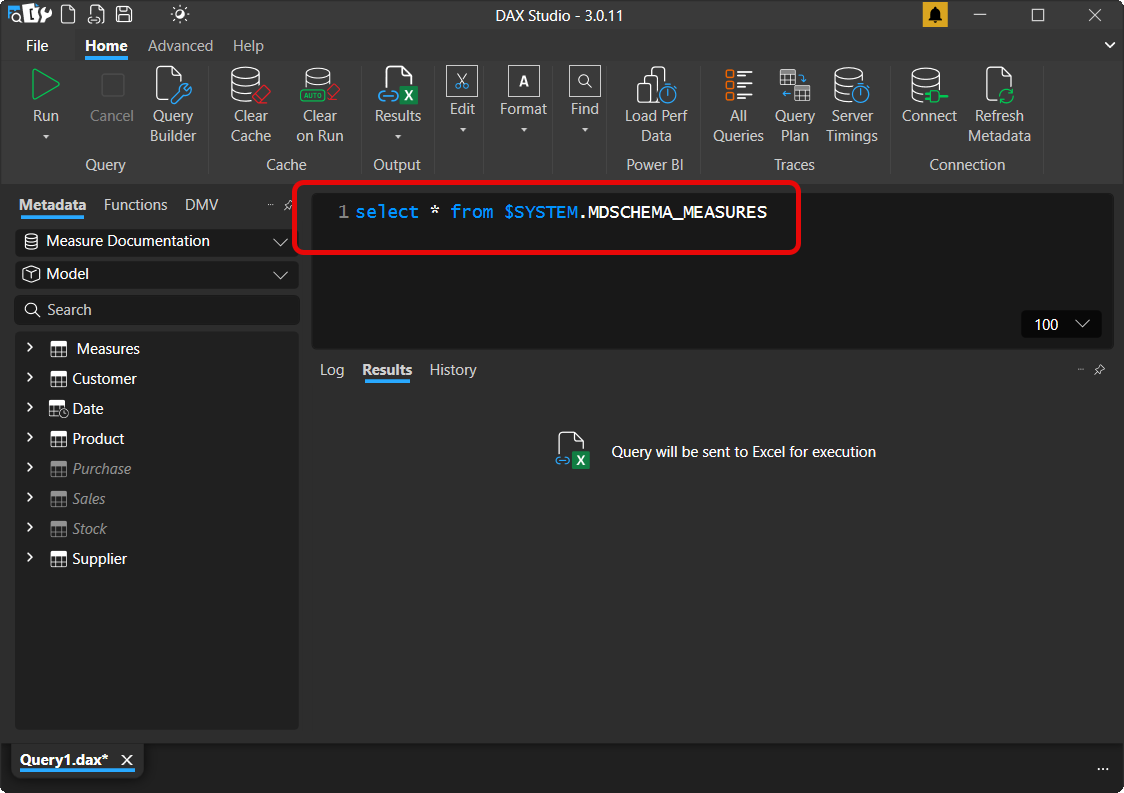
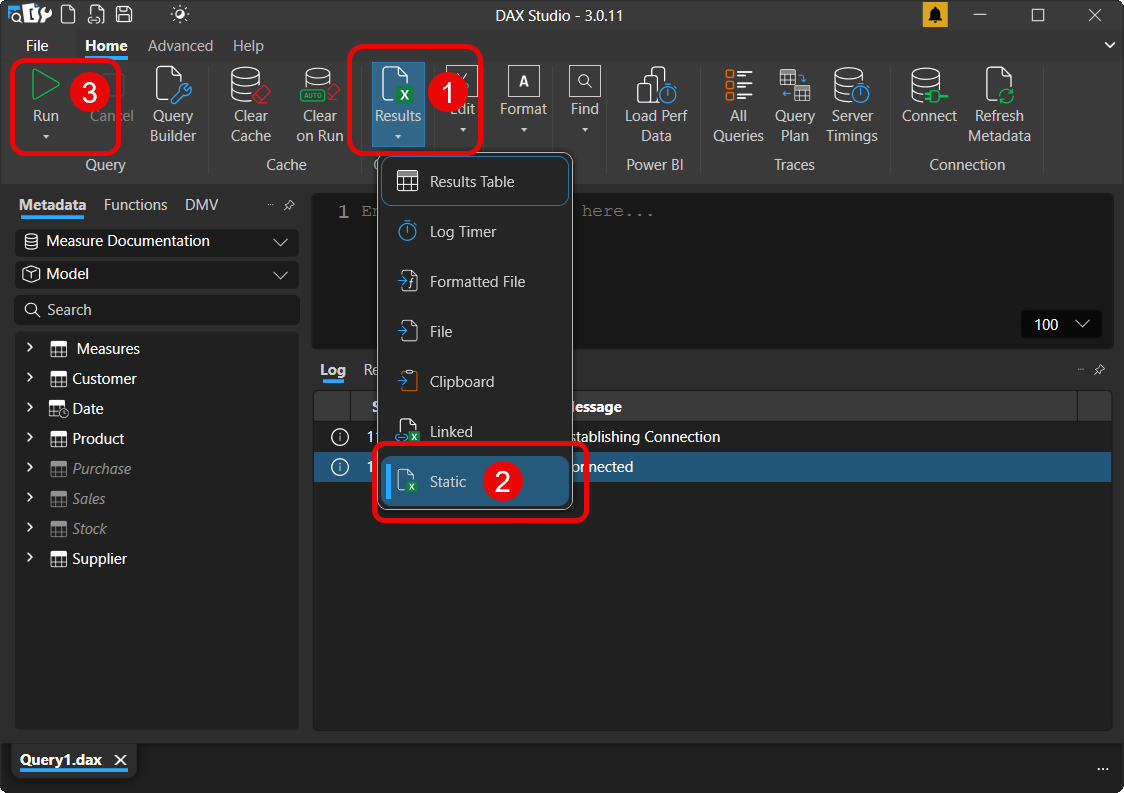
Next, choose the output type Static to and hit Run to send results into Excel file.
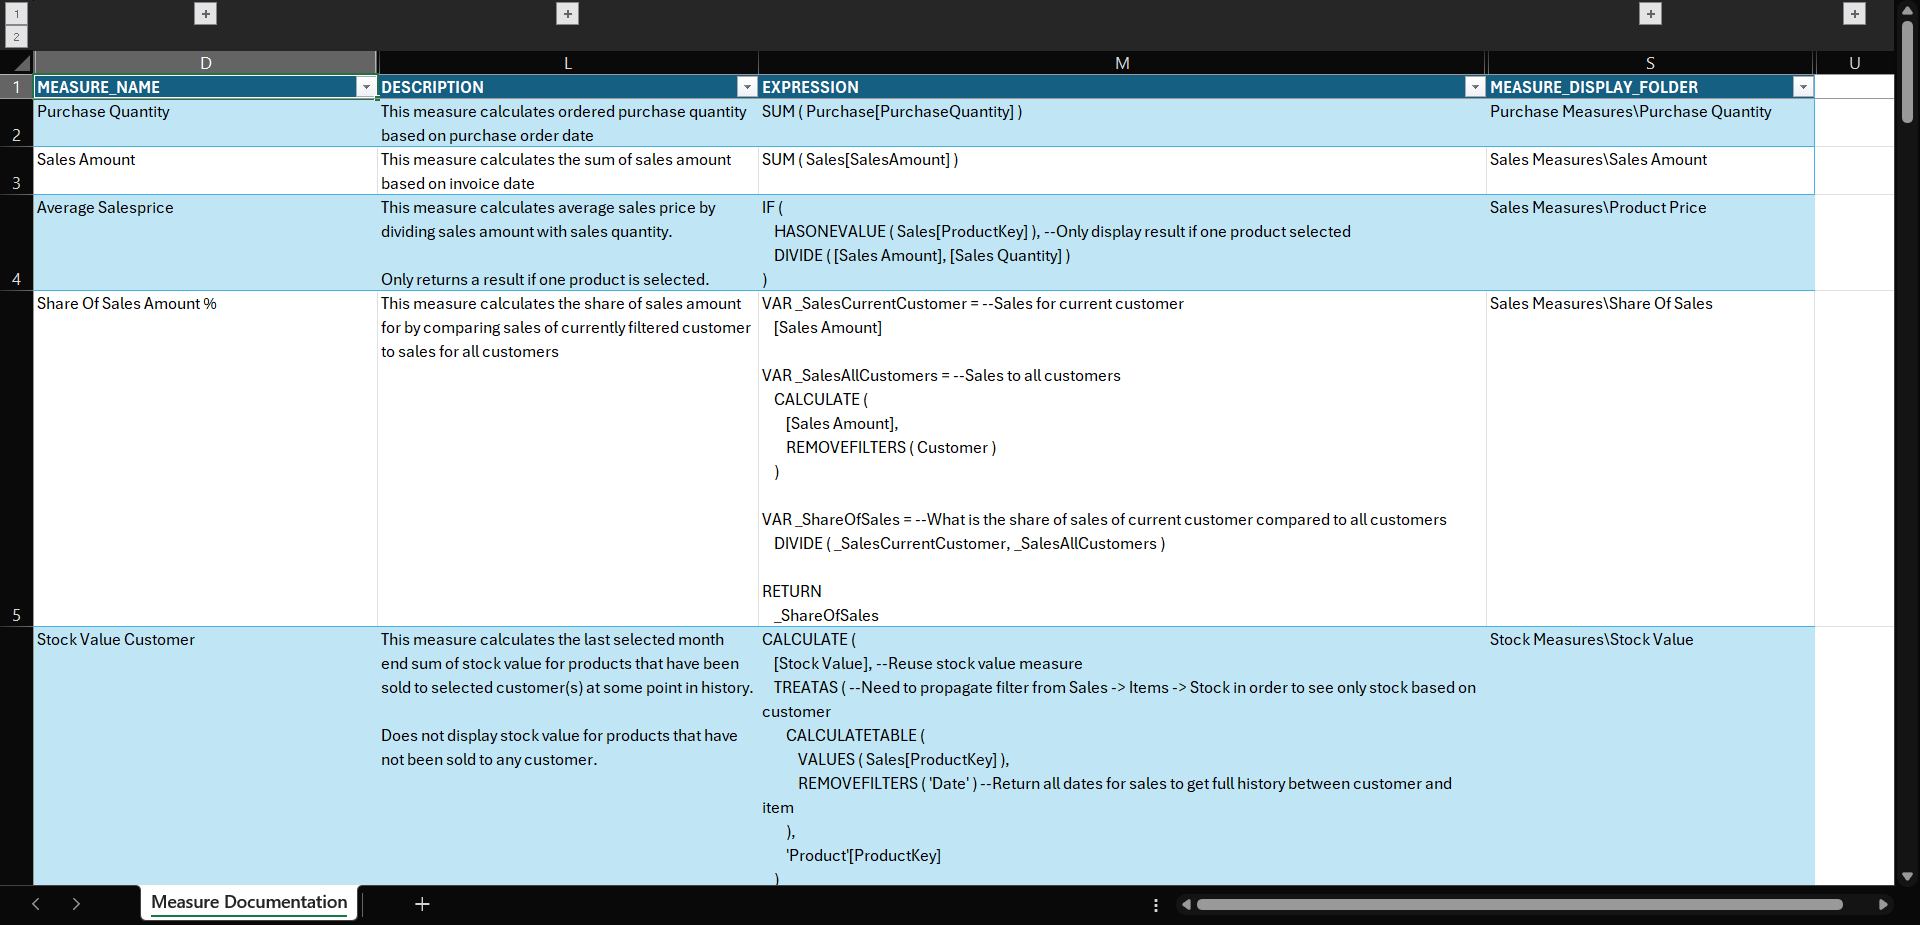
Step #3 — Format The Excel File
The final step is to clean up the Excel file. Here’s what I’ve usually done:
Pin first row
Top align all cell contents
Group not needed columns to hide them
Wrap text in DESCRIPTION & EXPRESSION columns
Set column width so that everything is displayed without scrolling
The switch to DAX Studio was a major step forward.
With few clicks I could create a measure documentation that was 100% guaranteed to contain latest information. I could also see the measure descriptions alongside with the DAX expression and easily filter the table. But it wasn’t all sunshine 🌥️.
I still needed to take manual steps to get it done.
Phase #3: The Best Practice
But that all changed when I stumbled into the YouTube channel by Christine Payton.
She had done a great video explaining how you can use the INFO.VIEW DAX functions to generate a calculated table that contains the same information as my semi-manual Excel measure documentation. Best of all, it was just one line of DAX code.
It really doesn’t get easier than this (5 seconds as promised in the title).
Measure Documentation = INFO.VIEW.MEASURES()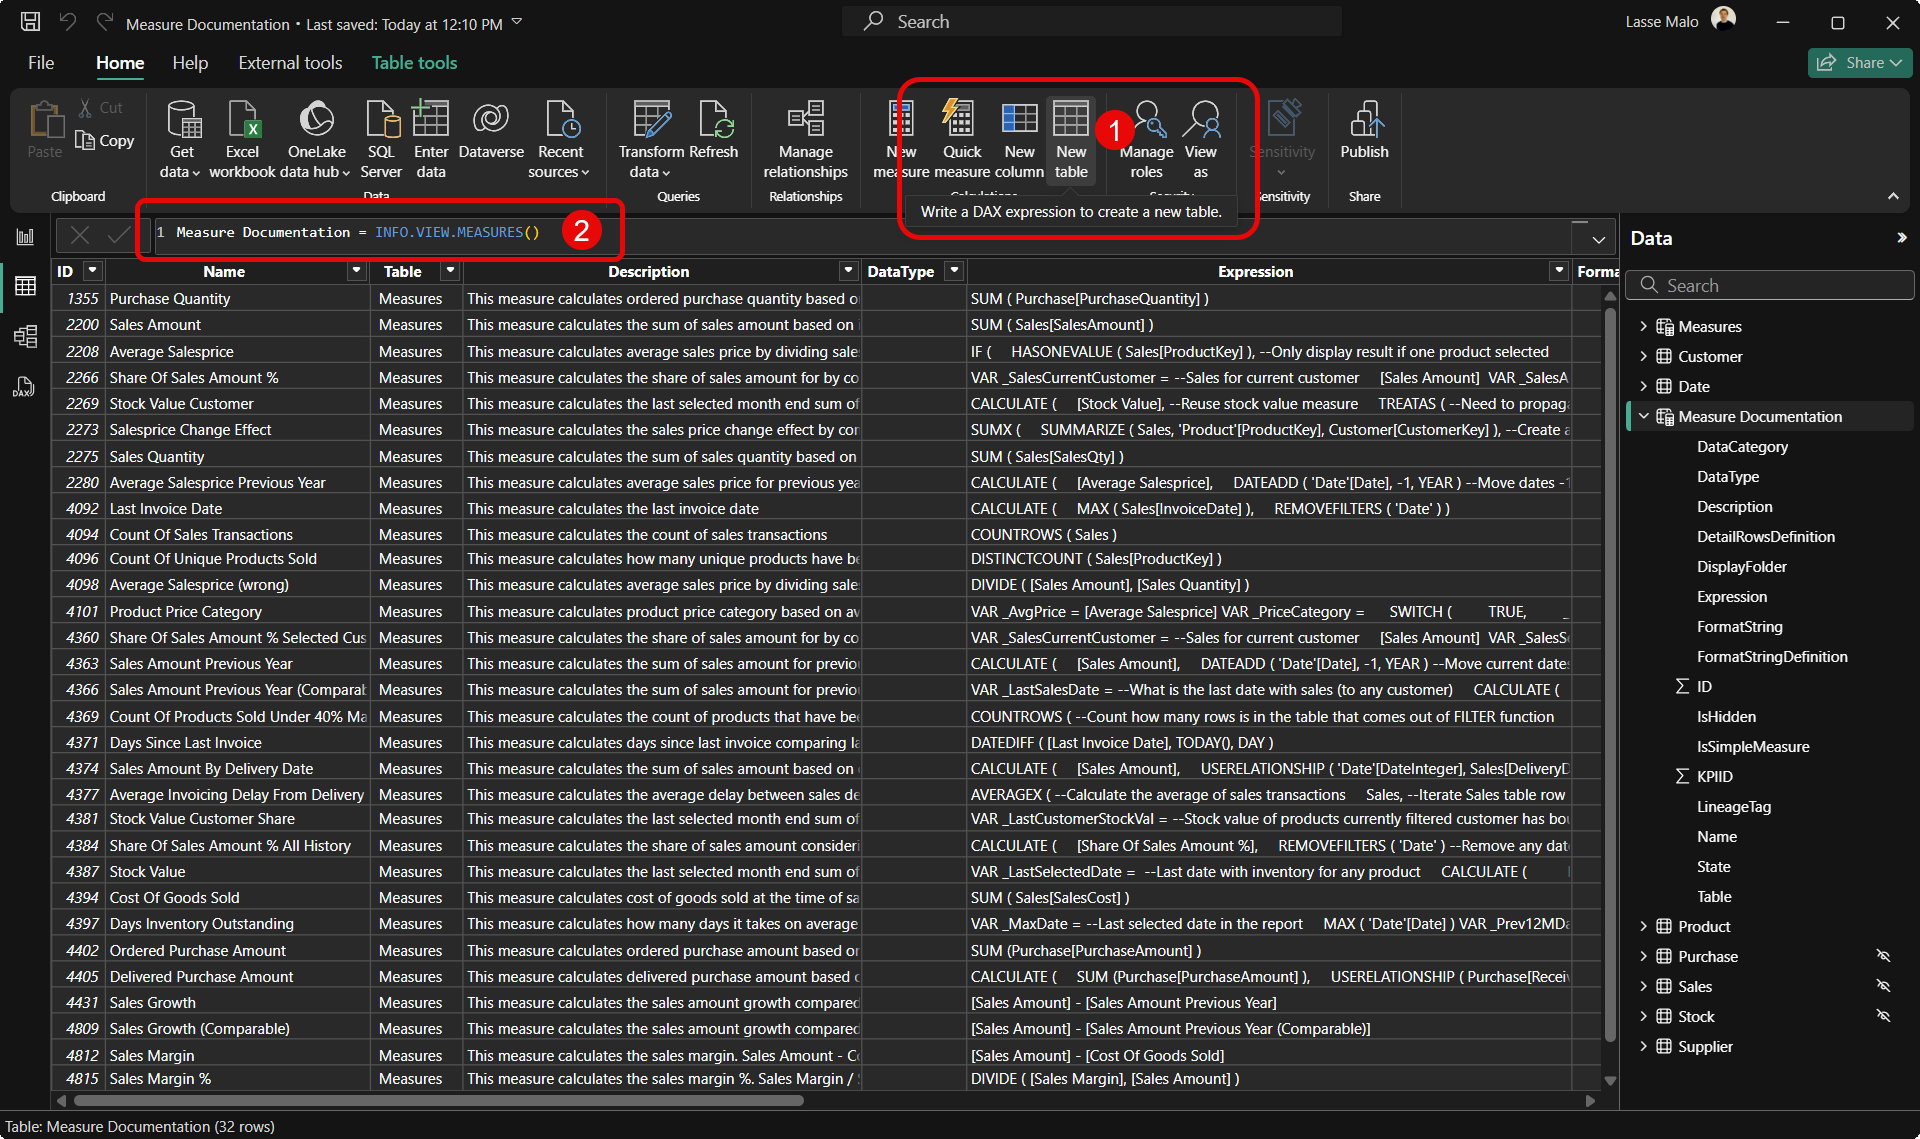
Whenever you create a report using live connection to this semantic model, you have a measure documentation table available that you can easily view, filter and best of all… copy paste the DAX code.
Here’s how it looks:
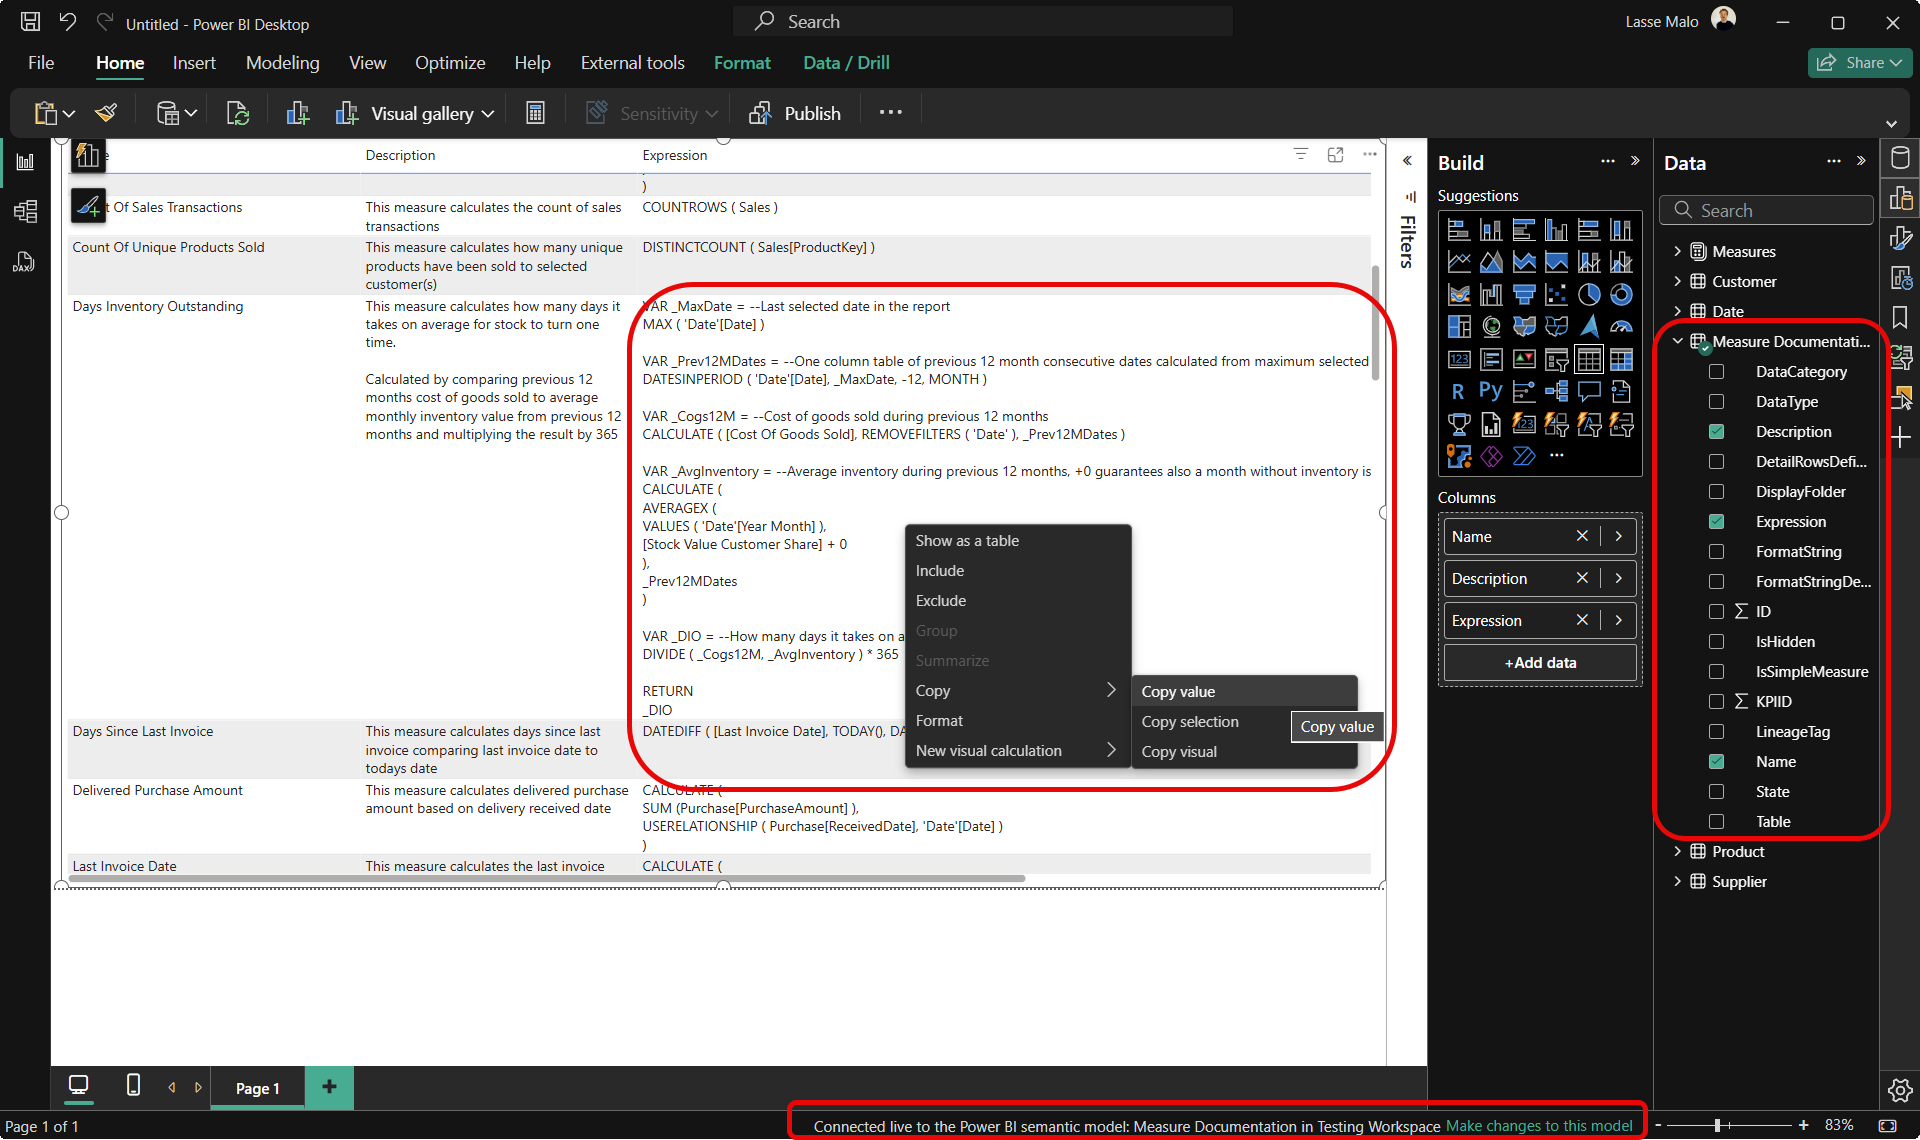
If you want, it’s also possible to automatically pull this measure documentation into Excel.
Here are the steps to get it done:
Get Data → From Power Platform
Choose your Dataset (still not called semantic model in Excel)
Insert Table (not Pivot Table) and choose the columns you want
Just remember to edit the connection properties of the query to automatically refresh the table when the Excel file is opened!
So, what did we learn from all of this? Keep your eyes always open and expose yourself to quality information sources (like the Power BI Insider 🧐) to develop your own best practices!